ASX 200 for the week starting 6th Mar 2017
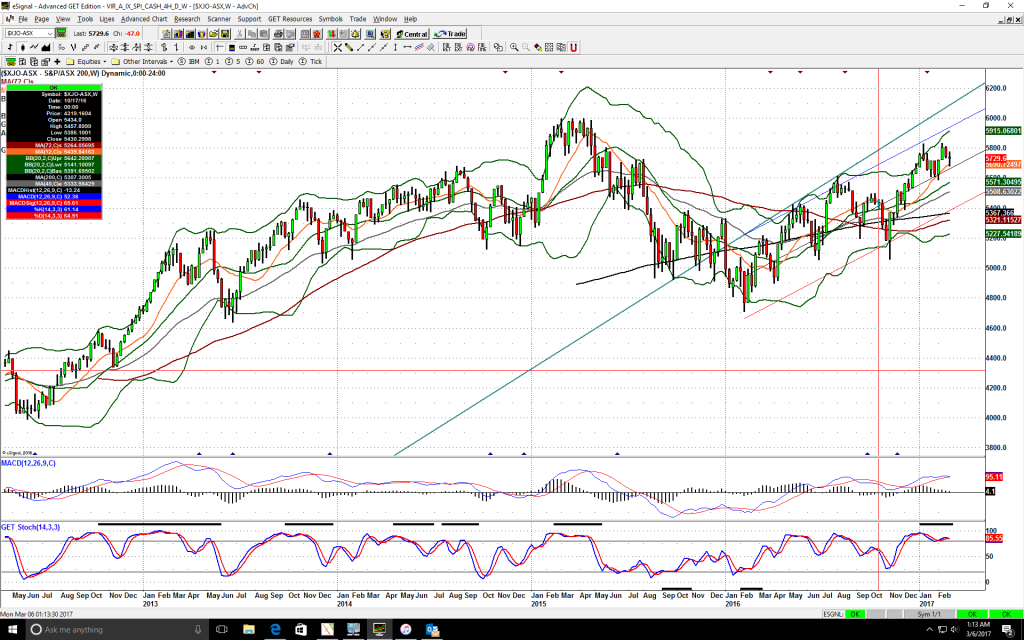
This is going to be an interesting week. Looking at the weekly chart, it looks bullish (see chart). It had an inside candle range and last week a lower low ( the low at support, normal) and a close near the open.
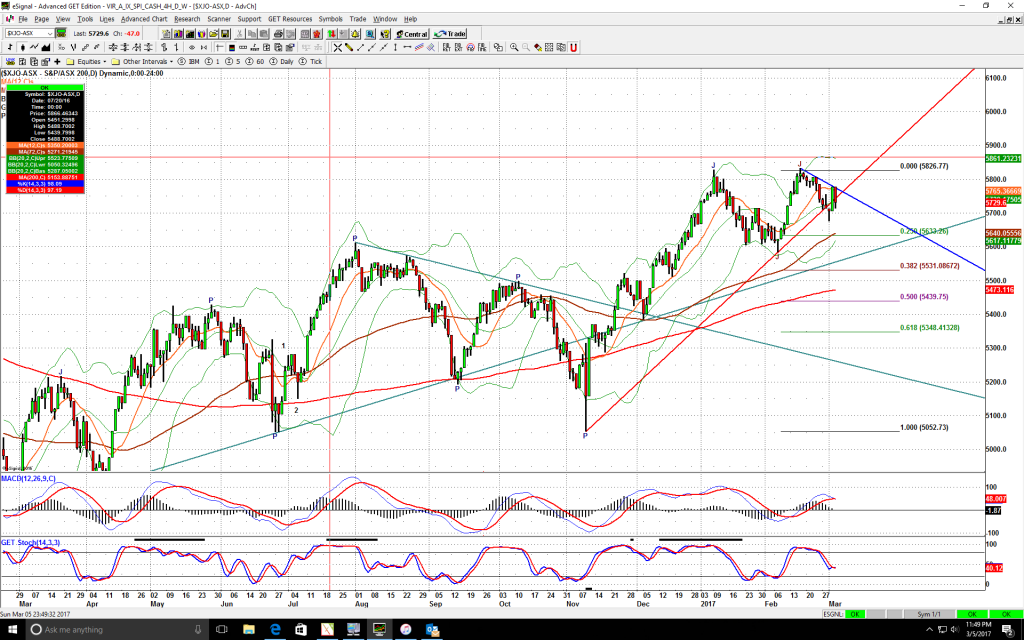
The bullish scenario would be the index to take the high in weekly (or the close on daily at the high on Thursday) at 5776, and climb towards 5800.
The problem though is that bearish reversal candle on Friday that made the down trend line (blue). So, if the index doesn’t take the blue trend line in the next day or two, it’s going to see the low at 5704, then 5675 (the two closest support) or lower.

