Learn Most Important Charting Patterns
The Big Picture: Important Charting Patterns
for Day Trading
“The real voyage of discovery consists not in seeking new landscapes but in having new eyes”
– Marcel Proust
In technical analysis, the definition of a PATTERN is the distinctive formation created by the movement of the price on a chart. A chart pattern is identified by a line connecting common price points – closing prices, highs and lows -over a period of time.
The ‘chartists’ – traders analyzing the historical prices and past trends on the chart trying to identify patterns -attempt to anticipate the future direction of the price also known as “trading pattern”.
The chart patterns will help you make good trading decisions in your everyday trading but it is the way our brain decides what is important and what is not that makes the difference.
Recognizing a chart pattern relies on how our perception works and it affects everyone differently even though we are looking at the same chart. The brain naturally seeks to reorder and reshape information received to relate that information to past experiences held in memory. It is a continual process of receiving information and then comparing that input to a benchmark. Having learnt and memorized the common chart pattern for trading Forex can only help your brain do the comparison and ultimately determine the your actions : enter a trade, take your profits or loss and stay longer in the position.
Let’s now see some examples and learn the most important charting patterns for trading any market:
Uptrend/Downtrend
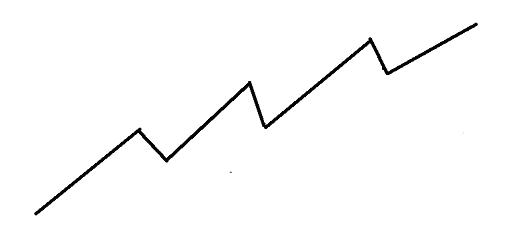
An uptrend is defined as a series of ascending peaks and troughs as illustrated below.

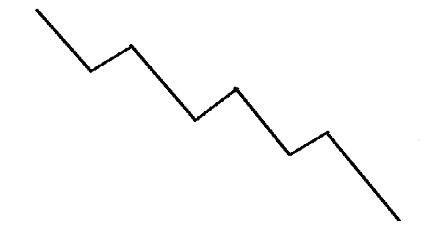
Conversely, a downtrend is defined as series of descending peaks and troughs as illustrated below.

Head and Shoulders
The Head and Shoulders Top is undoubtedly the best known and perhaps the most reliable of all major reversal patterns. During the formation of this pattern, the forces of supply and demand are in relative balance. Once the distribution phase is completed, support along the bottom of the horizontal range (called the neckline) is broken and a new downtrend is established. The neckline is very often slightly upward sloping to flat line.

The Head and Shoulders Bottom is simply an inverted image of the Head and Shoulder Top. The formation of this pattern occurs exactly the same as Head and Shoulder Top pattern except it is preceded by a downtrend. It marks the transition period at the end of a downtrend and the beginning of an uptrend.

Double Tops and Double Bottoms
The Double Top pattern is perhaps the most frequent and easily spotted of all the reversal pattern. For obvious reasons, this pattern is often referred to as an “M” top.
A Double Top pattern occurs after an uptrend and is comprised of two prominent peaks at approximately the same price level. As prices trend upward with successive peaks and troughs, prices encounter resistance and retreat temporarily. Prices then make a final attempt to rally, where they again encounter resistance at about the same price level as the previous peak. The conclusion of the Double Top formation occurs when prices close below the previous trough.

The Double Bottom is simply an inverted image of the Double Top. The formation of this pattern occurs exactly the same as the Double Top pattern except it is preceded by a downtrend. It marks the transition period at the end of a downtrend and the beginning of an uptrend

Triple Tops and Triple Bottoms
The Triple Top is a close cousin of the Head & Shoulders Top. It occurs after uptrend and is comprised of three peaks at approximately the same price level. Refer to the discussion of Head & Shoulders Tops and Double Tops for additional insight.

The Triple Bottom is simply an inverted image of the Triple Top. The formation of this pattern occurs exactly the same as the Triple Top pattern except is preceded by a downtrend.

Triangles
There are three categories of triangles: Ascending Triangle, Descending Triangle and Symmetrical Triangle. All are Trend Continuation Patterns TCP.
All three triangle patterns have three common elements: the base, apex, and a minimum of four reversal points. The base marks the beginning of the pattern and is the widest point. The height of the pattern, which is used in determining the price move objectives, is measured at the base. The apex marks the intersection of the trend lines drawn along the peaks and troughs. All triangle patterns require at least two peaks and two troughs.

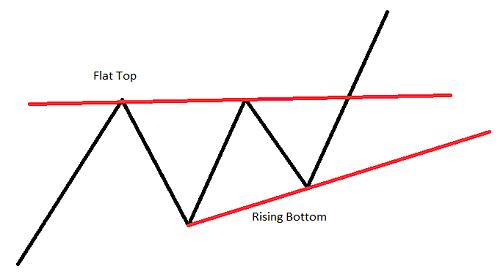
The Ascending Triangle is a bullish pattern that marks a pause in an uptrend. It has a rising lower line along the troughs with a flat upper line along the peaks. The conclusion of the Ascending Triangle occurs when the prices close above the resistance line along the peaks.
Important: A common mistake is to prematurely identify a Double Top as Ascending Triangle. The only difference is that the final pullback in the Double Top breaks below the previous trough.

The Descending Triangle is a bearish pattern that makes a pause in a downtrend. It has a falling upper line along the peaks with a flat lower line along the troughs. The conclusion of the Descending Triangle pattern occurs when prices close below the support line along the troughs.
Important: A common mistake is to prematurely identify a Double Bottom as a Descending Triangle. The only difference is that the final rally in the Double Bottom breaks above the previous peak.

The Symmetrical Triangle is a continuation pattern that makes a pause in the trend. It has a falling upper line along the peaks and a rising lower line along the troughs. The conclusion of the Descending Triangle pattern occurs when prices close below the support line along the troughs. The conclusion of the Symmetrical Triangle pattern occurs when prices close either below the support line along the troughs (during a downtrend), or when the prices close above the resistance line along the peaks (during an uptrend).

Wedges
The wedge formation is also similar to a symmetrical triangle in appearance, in that they have converging trend lines that come together at an apex. However, wedges are distinguished by a noticeable slant, either to the upside or to the downside.
A Falling Wedge is generally considered bullish and is usually found in uptrends. But they can also be found in downtrends as well. The implication however is still generally bullish. This pattern is marked by a series of lower tops and lower bottoms.


A Rising Wedge is generally considered bearish and is usually found in downtrends. They can be found in uptrends too, but would still generally be regarded as bearish. Rising wedges put in a series of higher tops and higher bottoms.


Flags and Pennants
Flags and pennants can be categorized as continuation patterns. They usually represent only brief pauses in a dynamic market. They are typically seen right after a big, quick move. The market then usually takes off again in the same direction. Research has shown that these patterns are some of the most reliable continuation patterns.
Bullish Flags are characterized by lower tops and lower bottoms, with the pattern slanting against the trend. But unlike wedges, their trend lines run parallel.

Bearish Flags are comprised of higher tops and higher bottoms. “Bear” flags also have a tendency to slope against the trend. Their trend lines run parallel as well.

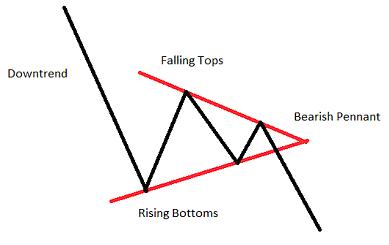
Pennants look very much like symmetrical triangles. But pennants are typically smaller in size/volatility and duration. Volume generally contracts during the pause with an increase on the breakout.


Rectangles
Rectangles should generally be traded as continuation patterns. They are indecision areas that are usually resolved in the direction of the trend. Research has shown that this is true far more often than not. Of course, the trend lines run parallel in a rectangle. Supply and demand seems evenly balanced at the moment. Buyers and sellers also seem equally matched. The same ‘highs’ are constantly tested as are the same ‘lows’. The market vacillates between two clearly set parameters.
While volume doesn’t seem to suffer like it does in other patterns, there usually is a lessening of activity within the pattern. But like the others, volume should noticeably increase on the breakout.


Leave a Reply