The Big Picture: UPTREND/DOWNTREND
The Big Picture: Important Charting Patterns
for Day Trading
“The real voyage of discovery consists not in seeking new landscapes but in having new eyes”
– Marcel Proust
In technical analysis, the definition of a PATTERN is the distinctive formation created by the movement of the price on a chart. A chart pattern is identified by a line connecting common price points – closing prices, highs and lows -over a period of time.
The ‘chartists’ – traders analysing the historical prices and past trends on the chart trying to identify patterns -attempt to anticipate the future direction of the price also known as “trading pattern”.
The chart patterns will help you make good trading decisions in your everyday trading but it is the way our brain decides what is important and what is not that makes the difference.
Recognising a chart pattern relies on how our perception works and it affects everyone differently even though we are looking at the same chart. The brain naturally seeks to reorder and reshape information received to relate that information to past experiences held in memory. It is a continual process of receiving information and then comparing that input to a benchmark. Having learnt and memorized the common chart pattern for trading Forex can only help your brain do the comparison and ultimately determine the your actions : enter a trade, take your profits or loss and stay longer in the position.
Let’s start with one of the most important and popular pattern: TREND
Uptrend/Downtrend
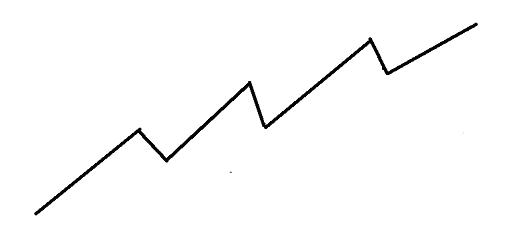
An uptrend is defined as a series of ascending peaks and troughs as illustrated below.
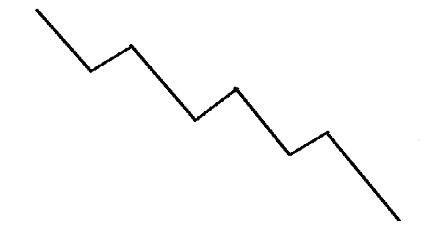
Conversely, a downtrend is defined as series of descending peaks and troughs as illustrated below.
How to recognise the trend
The simplest way is a visual inspection of the charts, starting with the higher timeframe and going down to lower ones.
Additionally you can develop a simple system using a couple of Moving Averages on you charts, with different time periods, for example MA 8 and MA 20. When the two line intersect it is a signal of potential changing of trend.