Heikin Ashi Charts
Candlestick charts “Heikin Ashi” Explained
So how does it look and what is a Heikin-Ashi chart ?
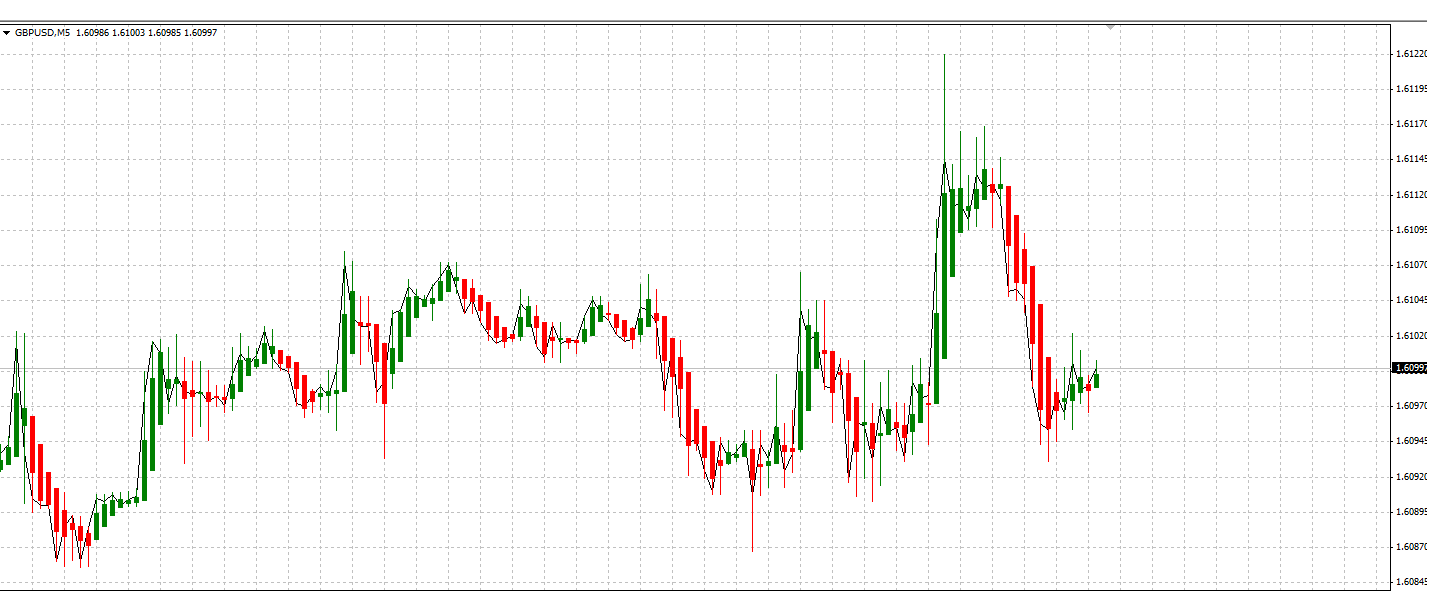
Heikin-Ashi chart looks like the candlestick chart, but the method of calculation and plotting of the candles on the Heikin-Ashi chart is different from the candlestick chart.
The candles of a Heikin-Ashi chart are related to each other: the open price of each candle is calculated using the previous candle close and open prices. Also the high and low price of each candle is affected by the previous candle. This makes a Heikin-Ashi chart slower than a candlestick chart and therefore the signals in a Heikin Ashi chart are delayed, when compared with a candle chart.
So is this ‘delay’ a good or bad thing?
The slow signals on Heikin Ashi charts made this candles good indicators for volatile markets – it can prevent us from rushing and making mistakes – entering or exiting a trade too soon or trading against the market. In addition, Heikin Ashi candles are easier to read when compared to the normal candlestick charts because they don’t have too many different patterns.
Heikin Ashi Chart Patterns:
Heikin Ashi Bullish Candles

In a bullish move, the Heikin Ashi candles have big bodies and long upper shadows but no lower shadow. Look at the up trends in the above chart. As you see some of the green candles have big bodies, long upper shadows and no lower shadow.
When the trend gathers momentum, the bodies of the Heikin Ashi candles are longer – see the circled candle- eventually culminating with a candle with a extremely long upper shadow (sign of an upcoming reversal – see reversal pattern below).
Heikin Ashi Bearish Candles
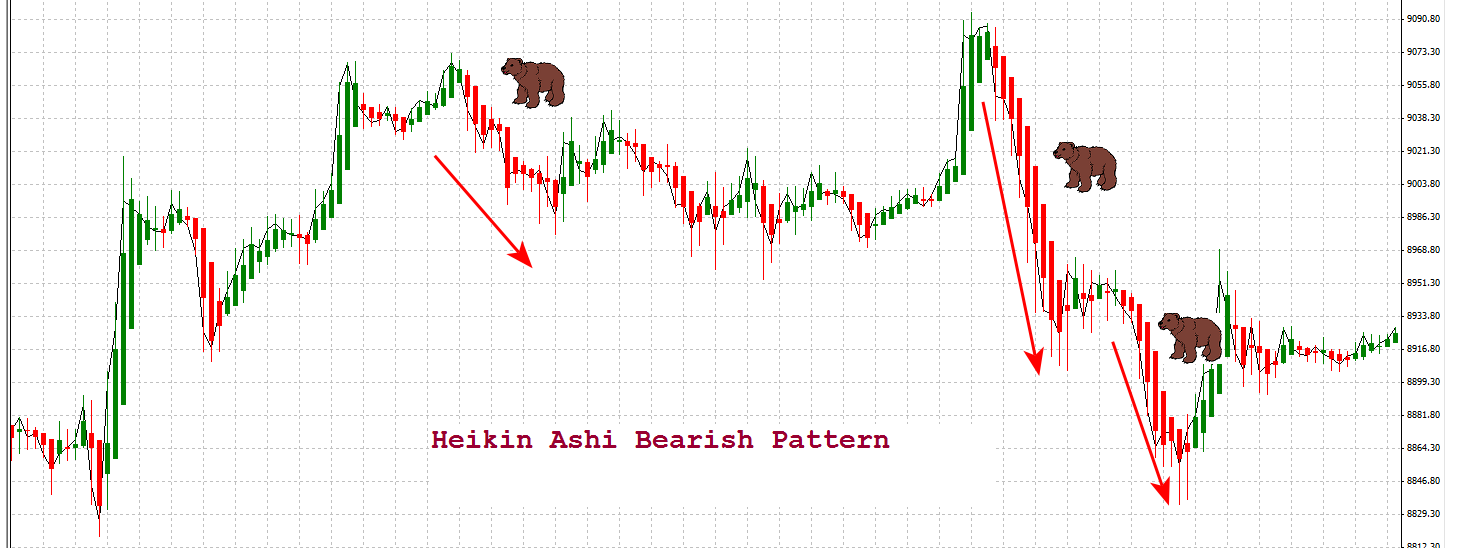
In a bearish move the Heikin Ashi candles have big bodies and long lower shadows but no upper shadow. Look at the downtrends in the above chart. As you see some of the red candles have big bodies, long lower shadows and no upper shadow.
Heikin Ashi Revesal Candles
The reversal pattern is quite easy to spot on a Heikin Ashi chart – it is the candle with a very long shadow that sticks out from the other candles. In a bullish trend if you see the long upper shadow forming, it is a sign of reversal or at minimum a sign that the trend has lost its steam. On contrary, in a bearing move, the reversal is signaled by a long lower shadow.


